Market Update
On Wednesday, spot gold traded near $4,304 per ounce. Despite mixed US nonfarm payroll signals, rising unemployment in November reinforced expectations of future Federal Reserve rate cuts, helping support gold prices and keeping volatility limited.
Meanwhile, WTI crude traded near $55.15 per barrel, with oil prices falling more than 2.6% to their lowest level in nearly five years. Persistent oversupply concerns and expectations that a potential Russia–Ukraine peace deal could ease sanctions on Russian oil continued to weigh heavily on the market.
Gold
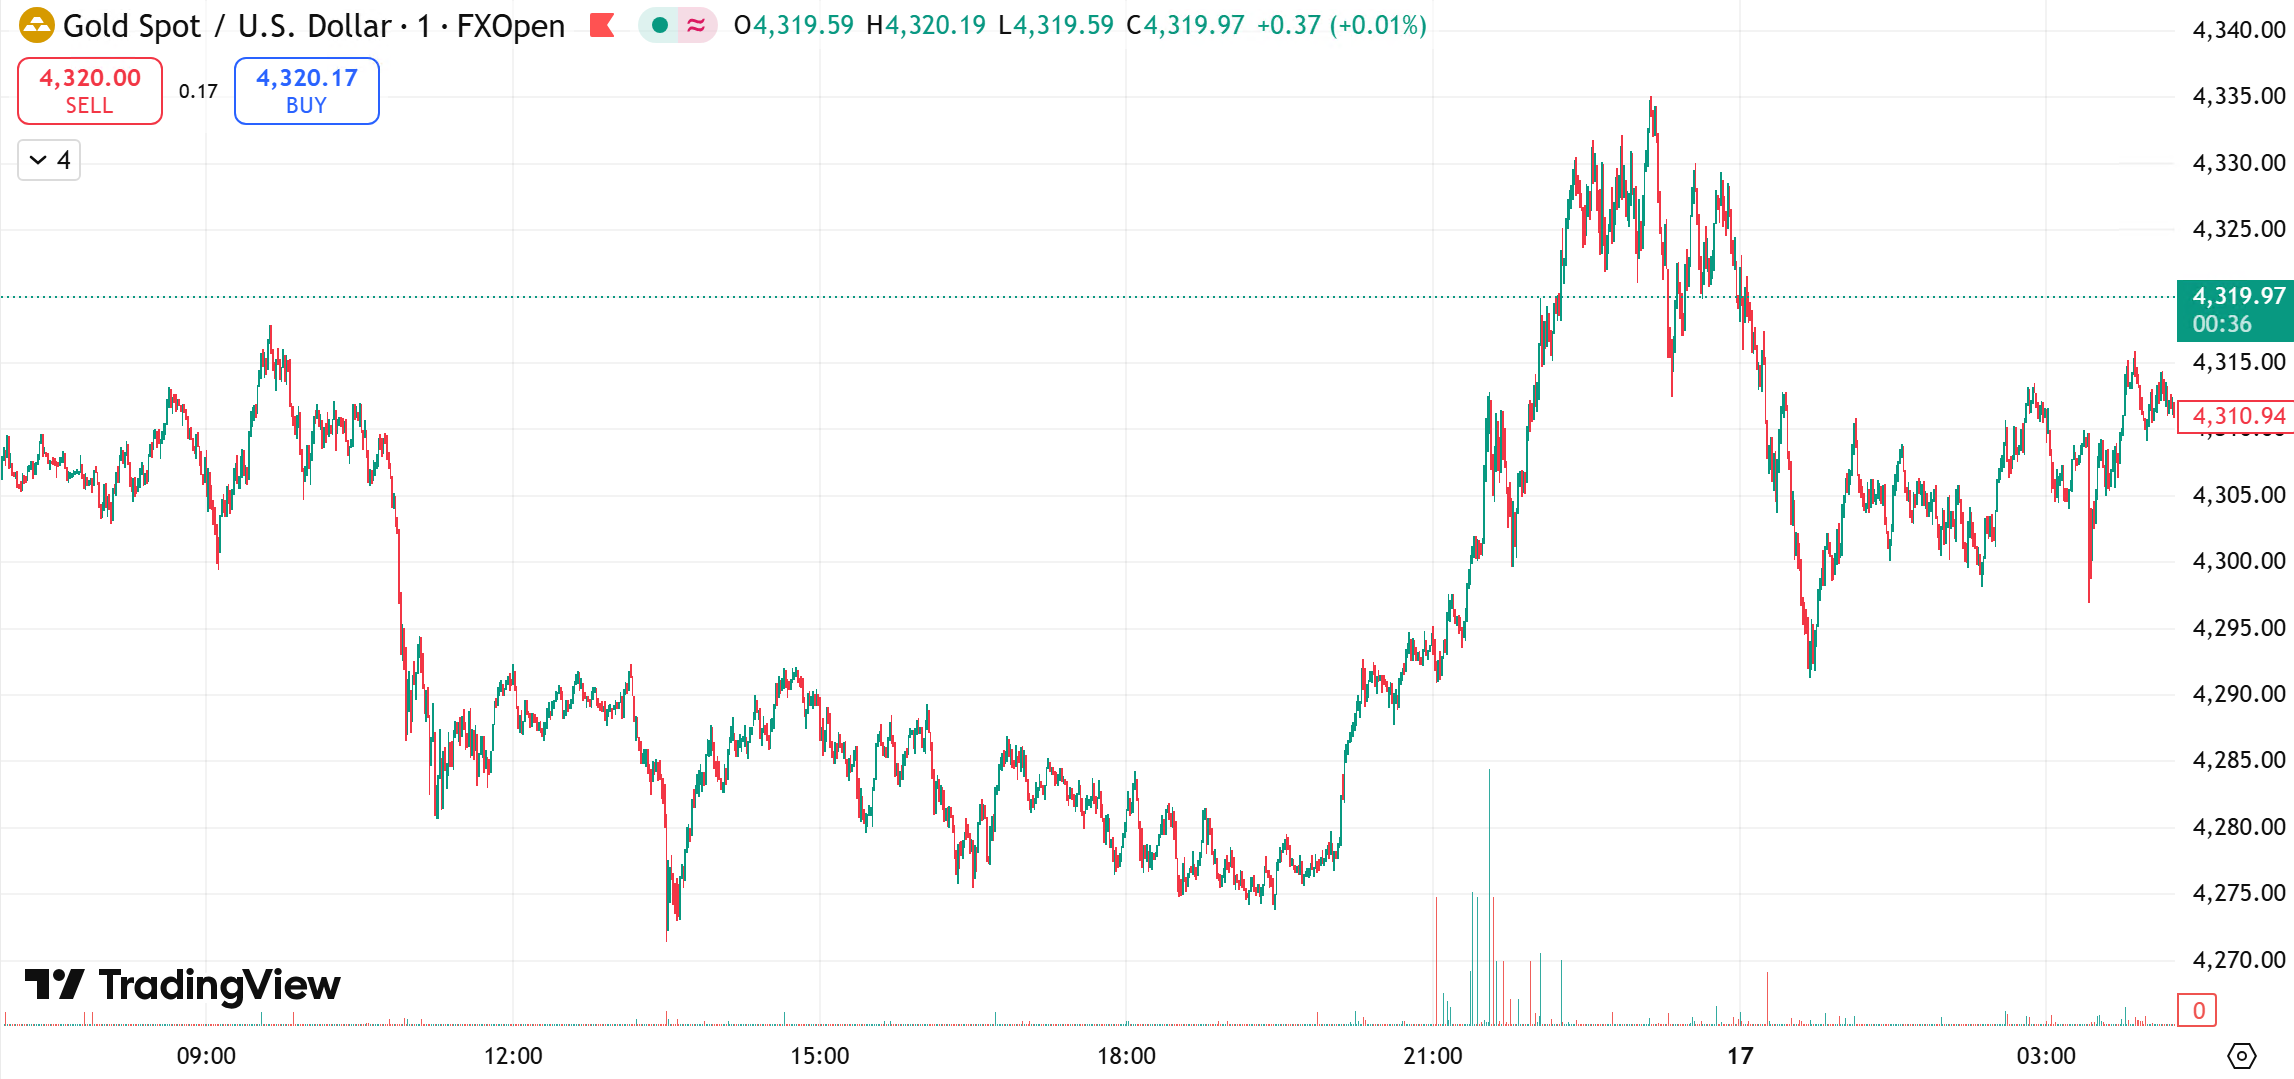
Gold prices edged slightly higher on Tuesday, supported by an uptick in the US unemployment rate, which strengthened expectations that the Federal Reserve may begin cutting rates in the future. A softer dollar and lower Treasury yields added to gold’s appeal.
By the close, spot gold rose 0.2% to $4,310.21 per ounce, while US gold futures slipped marginally by 0.1%. The US dollar index fell to a two-month low, and the 10-year Treasury yield edged lower, both of which provided additional support to bullion.
Market participants noted that the latest labor market data gave the Fed more justification to move toward easing. Although US nonfarm payrolls rebounded in November, the unemployment rate rose to 4.6% from 4.4%, exceeding expectations. Interest-rate futures now suggest the Fed could deliver around 59 basis points of cumulative rate cuts in 2026.
Investors are now turning their attention to upcoming US inflation data, including November CPI and PCE figures, which will be key in confirming the inflation trajectory. Some analysts project that if gold closes above $4,400 in 2025, prices could potentially move into the $4,859–$5,590 range in 2026.
Technical Outlook
From a technical perspective, gold initially dipped near $4,290 early in the session before rebounding sharply, briefly testing the $4,350 area. Prices later pulled back, with the session low near $4,285, before settling around $4,305, forming a shooting star candlestick with a long upper shadow.
This pattern suggests fading bullish momentum near the highs and points toward a high-range consolidation. The $4,335 area now acts as a key intraday pivot. Failure to break above this level could lead to a pullback toward $4,270–$4,250, where strong support is expected.
If prices manage to reclaim and hold above $4,335, the next upside targets are $4,345 and a retest of the recent high near $4,350. A sustained breakout above $4,350 would reopen the path toward $4,380.
On the 4-hour chart, gold remains above the EMA50, indicating short-term structural support, but repeated failures near the $4,335–$4,345 zone highlight heavy overhead selling pressure. A corrective phase may unfold before the market establishes a clearer directional bias.
Today’s Focus
Trading bias: Buy on dips, sell on rallies.
- Resistance: 4350–4370
- Support: 4310–4290
Oil
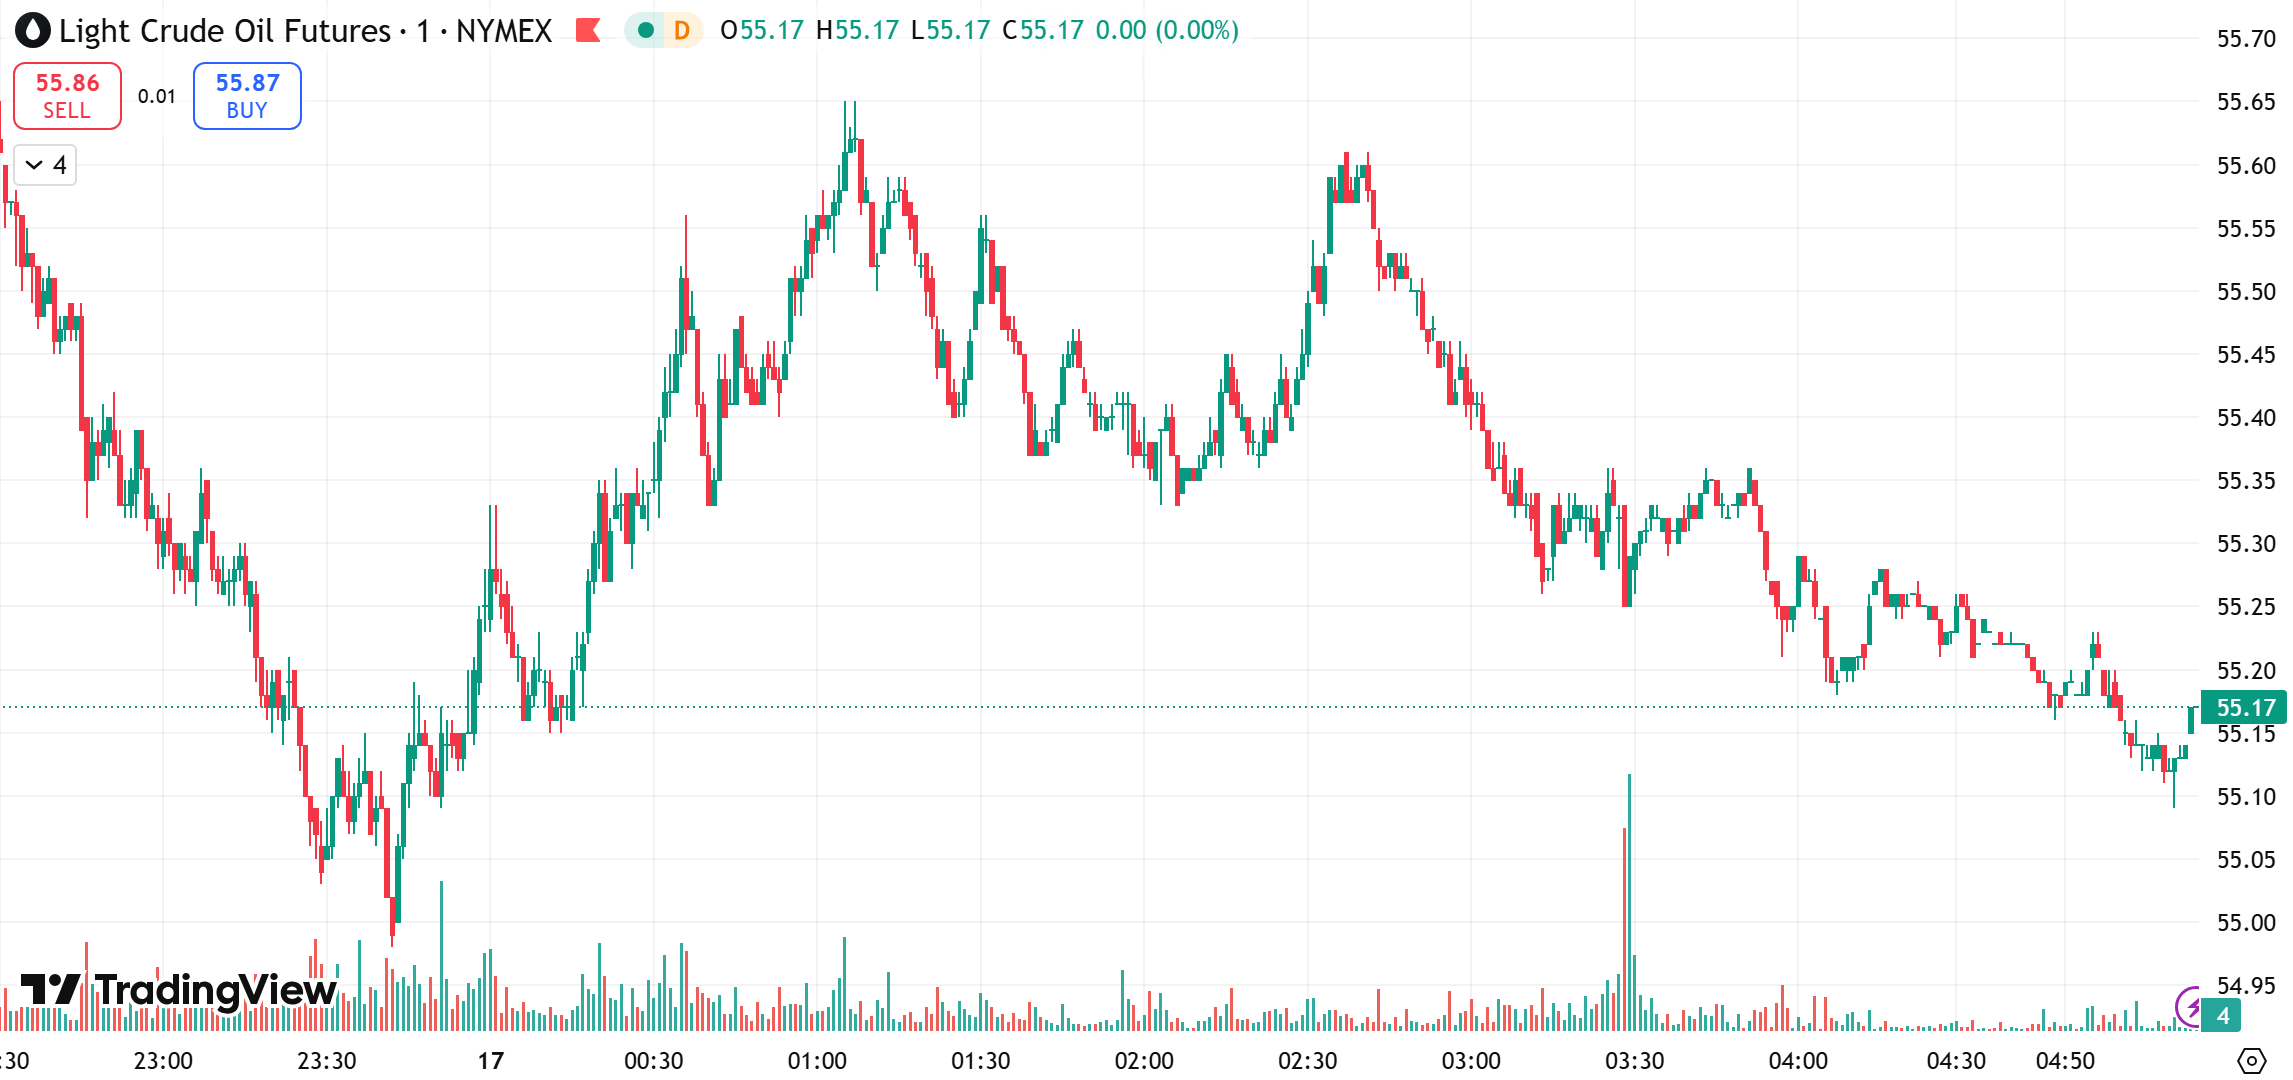
Oil prices extended their decline on Tuesday, settling at their lowest levels since February 2021. Ongoing oversupply concerns, combined with expectations that a Russia–Ukraine peace agreement could lead to looser sanctions on Russian exports, continued to pressure crude markets.
Brent crude fell around 2.7% to $58.92 per barrel, while WTI dropped 2.6% to $55.17 per barrel. Analysts highlighted that a potential peace deal could allow additional Russian supply to return to global markets, worsening the already fragile supply-demand balance.
Adding to bearish sentiment, the six-month Brent time spread turned into contango for the first time since October, signaling ample near-term supply. While last week’s US seizure of an oil tanker near Venezuela briefly provided support, its impact was largely offset by rising floating storage levels and preemptive purchases of Venezuelan crude by several buyers.
Technical Outlook
From a technical standpoint, oil remains locked in a secondary consolidation within a broader downtrend. Daily charts show repeated tests of the $56 area, with momentum indicators firmly bearish.
On the 1-hour chart, prices continue to trend lower, with moving averages aligned bearishly. The MACD remains below the zero line, reflecting strong downside momentum. Early-session trading shows mild consolidation at depressed levels, but downside risks remain dominant.
A break below $56 would likely accelerate the decline toward deeper medium-term support zones.
Today’s Focus
Trading bias: Sell on rallies, buy cautiously on deep pullbacks.
- Resistance: 57.0–58.0
- Support: 54.0–53.0
Risk Disclosure
Trading Securities, Futures, CFDs and other financial products involve high risks due to the rapid and unpredictable fluctuation in the value and prices of these underlying financial instruments. This unpredictability is due to the adverse and unpredictable market movements, geopolitical events, economic data releases, and other unforeseen circumstances. You may sustain substantial losses including losses exceeding your initial investment within a short period of time.
You are strongly advised to fully understand the nature and inherent risks of trading with the respective financial instrument before engaging in any transactions with us. When you engage in transactions with us, you acknowledge that you are aware of and accept these risks. You should conduct your own research and consult with an independent qualified financial advisor or professional before making any financial, trading or investment decisions. This blog may contain speculative statements regarding future expectations, plans, or projections based on information and assumptions currently available to D Prime. Although D Prime considers these assumptions reasonable, such statements involve risks, uncertainties, and factors beyond D Prime’s control, and actual outcomes may differ significantly.
Disclaimer
This information contained in this blog is for general informational purposes only and should not be considered as financial, investment, legal, tax or any other form of professional advice, recommendation, an offer, or an invitation to buy or sell any financial instruments. The content herein, including but not limited to data, analyses and market commentary, is presented based on internal records and/or publicly available information and may be subject to change or revision at anytime without notice and it does not consider any specific recipient’s investment objectives or financial situation. Past performance references are not reliable indicators of future performance.
D Prime and its affiliates make no representations or warranties about the accuracy or completeness of this information and disclaim any and all liability for any direct, indirect, incidental, consequential, or other losses or damages arising out of or in connection with the use of or reliance on any information contained in this blog. The above information should not be used or considered as the basis for any trading decisions or as an invitation to engage in any transaction.
D Prime does not guarantee the accuracy or completeness of this report and assumes no responsibility for any losses resulting from the use of this report. Do not rely on this report to replace your independent judgment. You should conduct your own research and consult with an independent qualified financial advisor or professional before making any financial, trading or investment decisions.